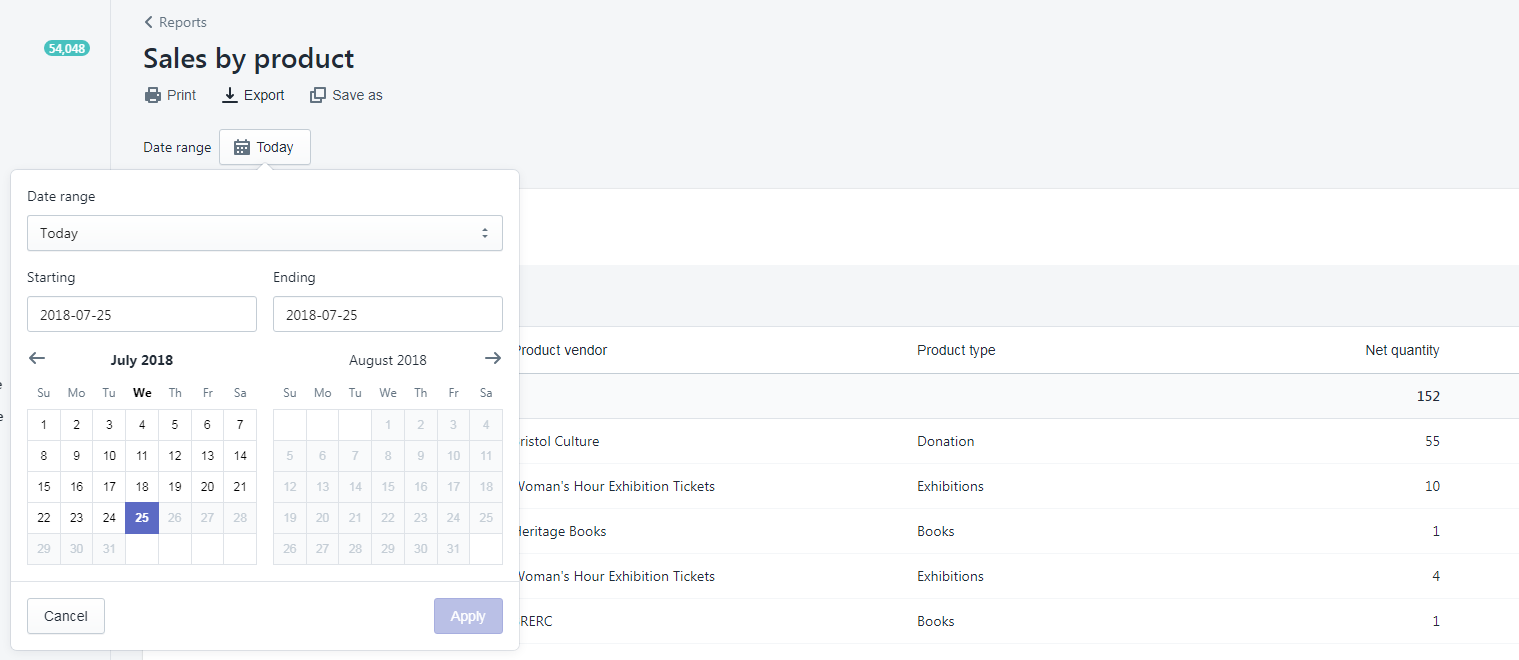
In team digital we like to make things look easy, and in doing so we hope to make life easier for people. A recent challenge has been how to recreate the Top sales by product analysis from the Shopify web application in Google Docs to see how the top 10 selling products compare month by month. The task of creating a monthly breakdown of product sales had up until now been a manual task of choosing from a date picker, exporting data, copying to google sheets, etc.
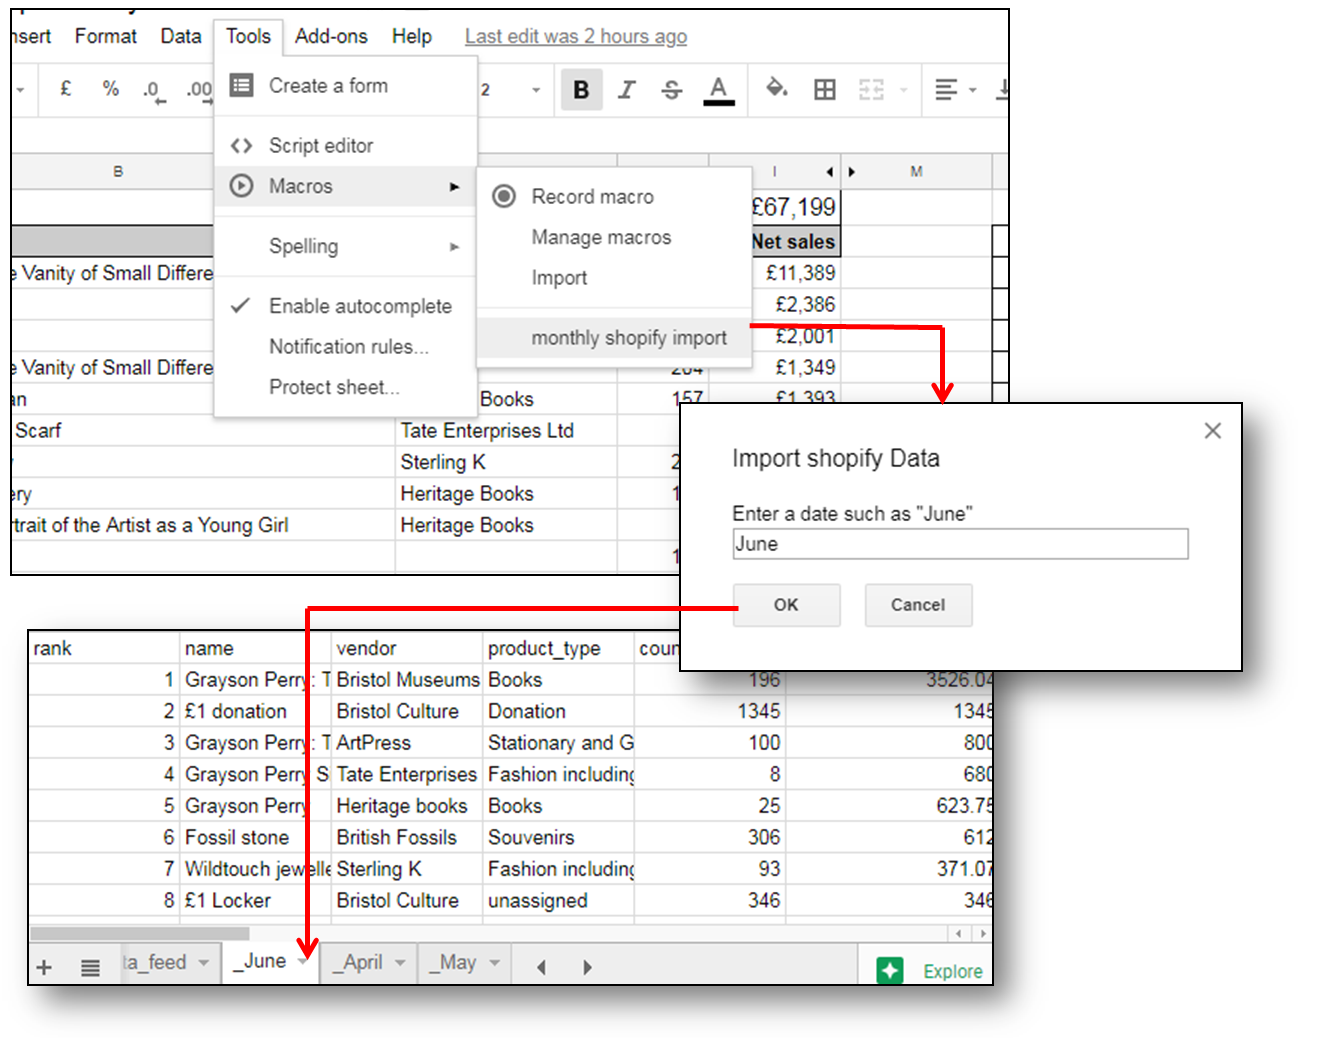
Having already had some success pushing and pulling data to google sheets using google apps script and our Culture Data platform, we decided to automate the process. The goal was to simplify the procedure of getting the sales analysis into Google docs to make it as easy as possible for the user – all they should need to do would be to select the month they wish to import.
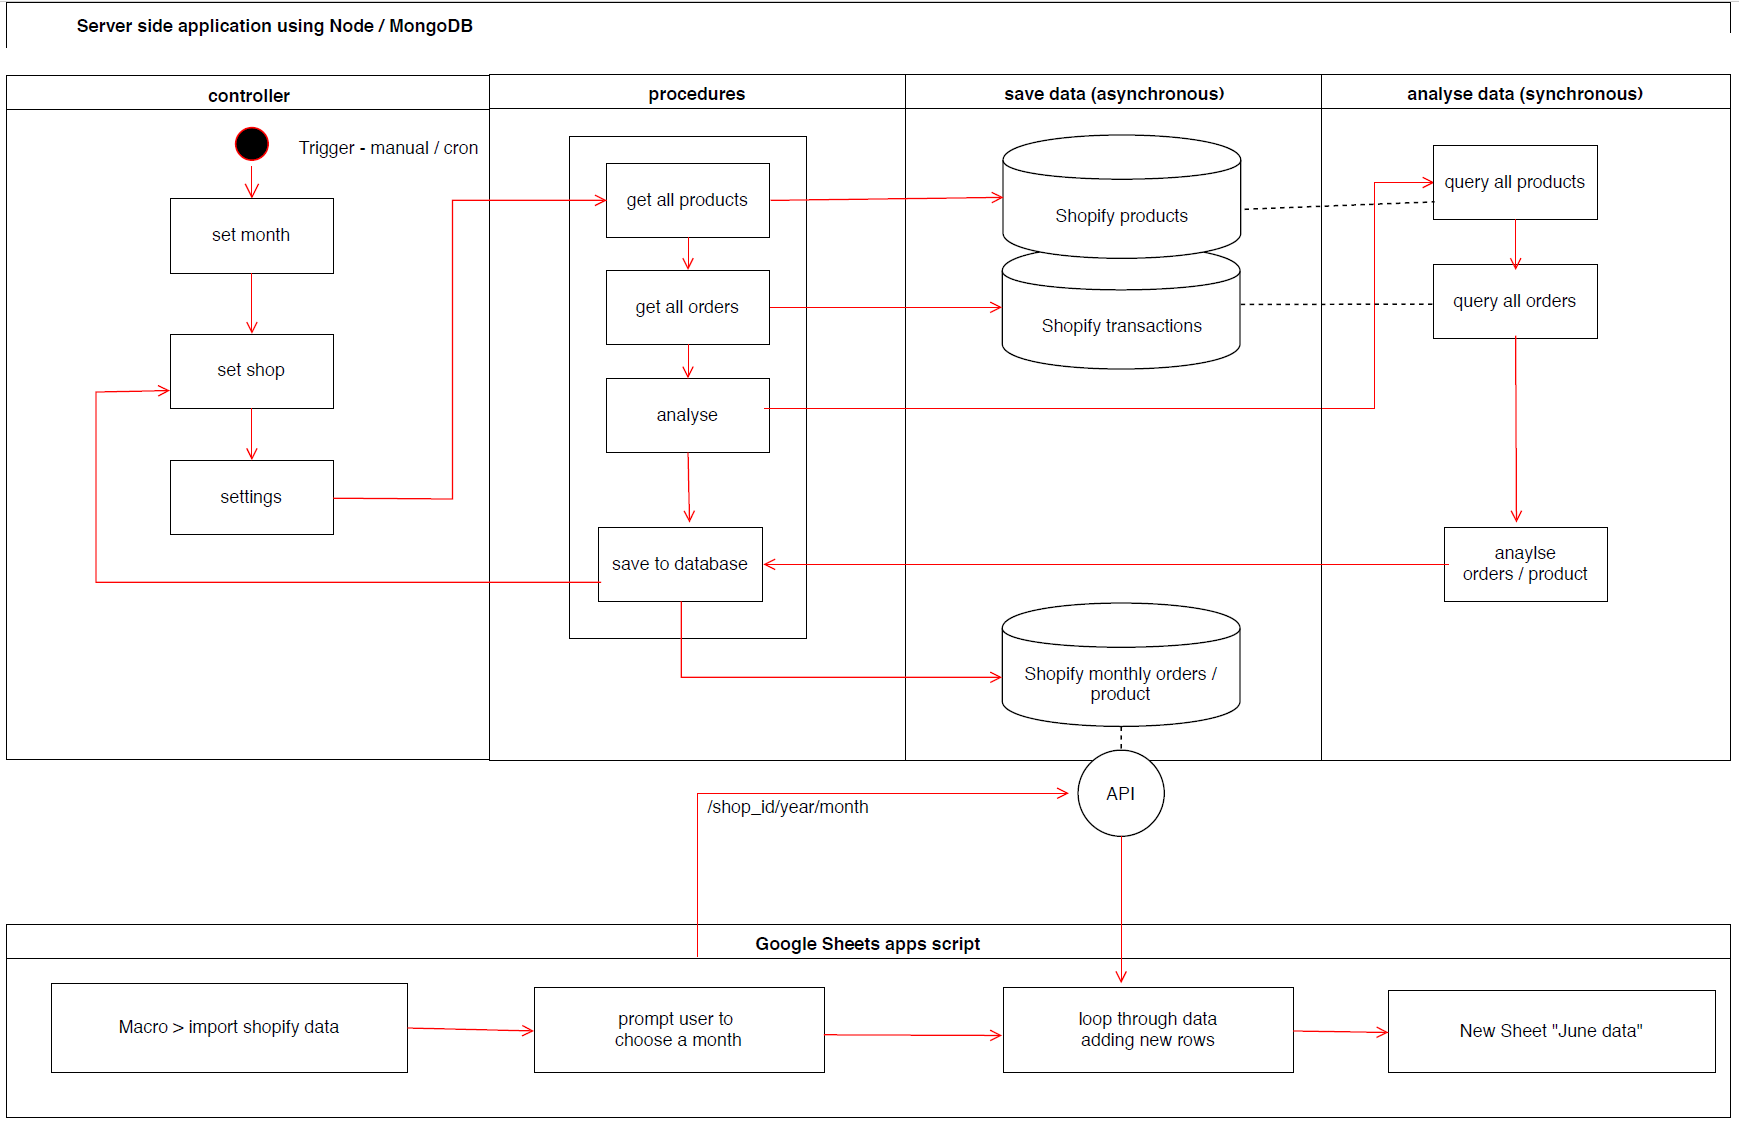
We have developed a set of scripts for extracting data using the Shopify API, but needed to decide how to get the data into Google Sheets. Whilst there is a library for pushing data from a node application into a worksheet, our trials found it to be slow and prone to issues where the sheet did not have enough rows or other unforeseen circumstances. Instead, we performed our monthly analysis on the node server and saved this to a local database. we then built an api for that database that could be queried by shop and by month.
The next step, using google script was to query the api and pull in a month’s worth of data, then save this to a new sheet by month name. This could then be set added as a macro so that it was accessible in the toolbar for the user in a familiar place for them, at their command.

As the data is required on a monthly basis, we need to schedule the server side analysis to save a new batch of data after each month – something we can easily achieve with a cron job. The diagram below shows roughly how the prototype works from the server side and google sheets side. Interestingly, the figures don’t completely match up to the in-application analysis by Shopify, so we have some error checking to do, however we now have the power to enhance the default analysis with our own calculations, for example incorporating the cost of goods into the equation to work out the overall profitability of each product line.
